Full Report
Figures converted from Hong Kong dollars at historical FX rates — see data/company.json.fx_rates for the rate table (the HK$ is pegged to the US$ at roughly 0.128 across all periods shown). Ratios, margins, and multiples are unitless and unchanged.
The arena: one Hong Kong holding company, seven operating businesses
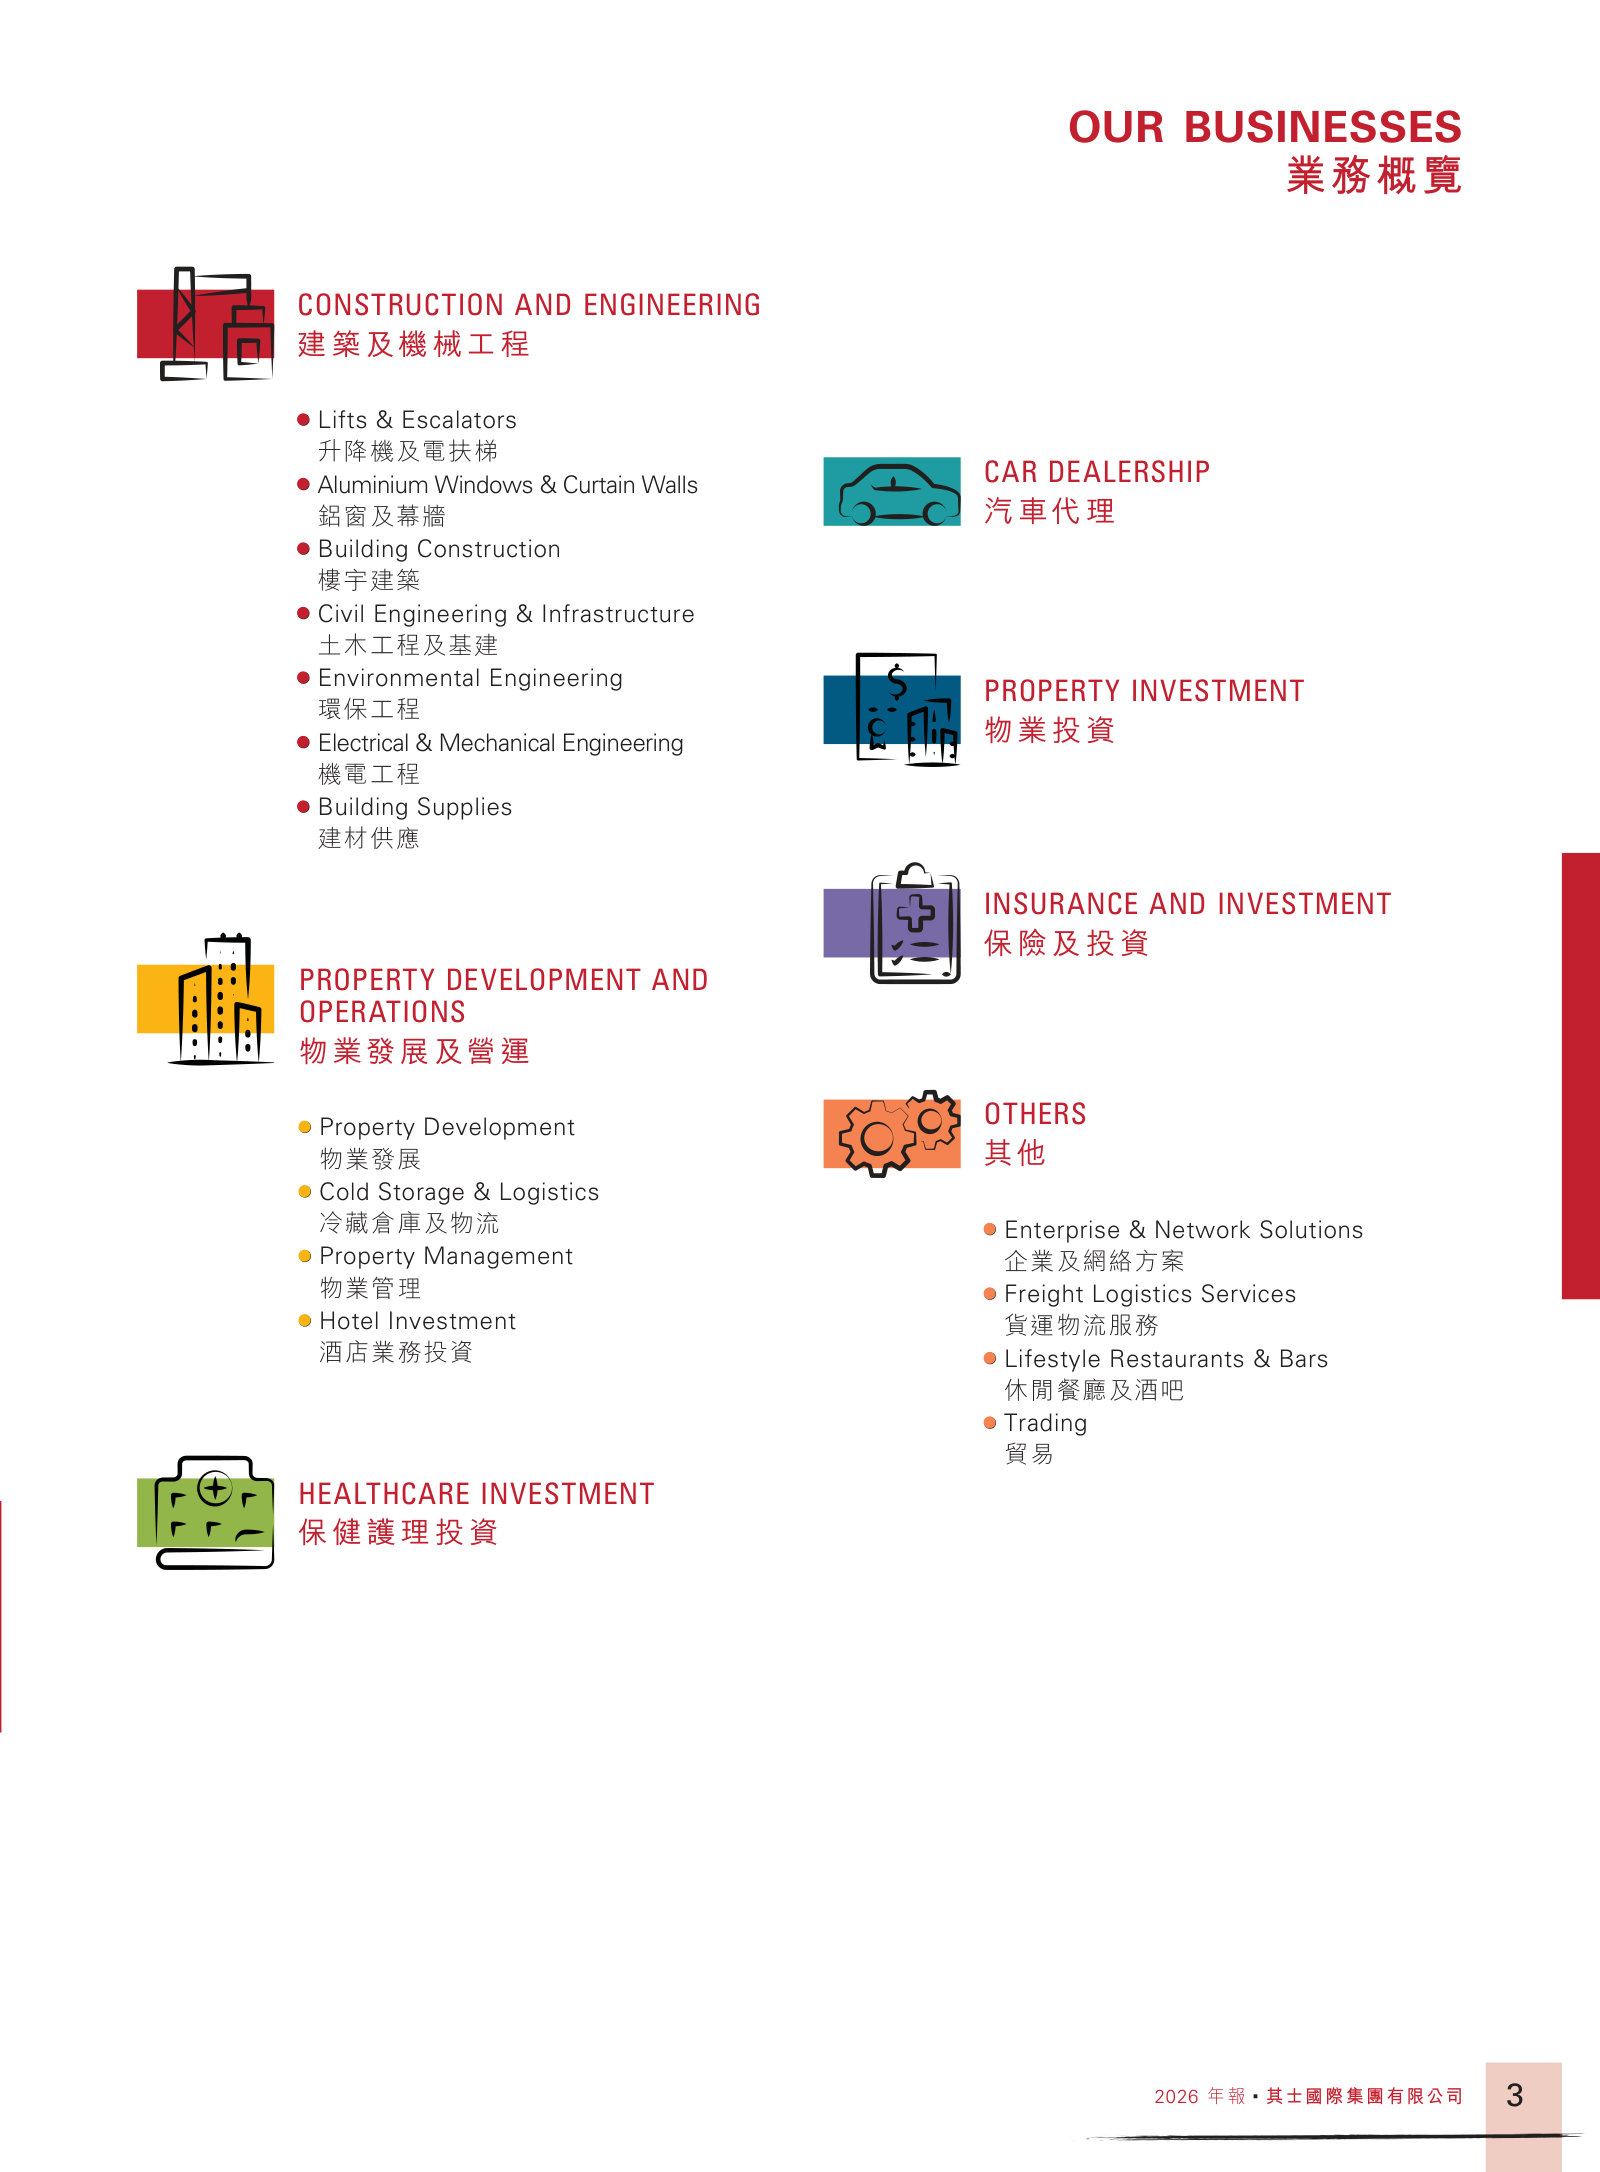
Chevalier International is not a single-industry company; it is a Hong Kong-listed, Bermuda-incorporated holding company that owns and operates seven distinct businesses at once — construction and engineering, property investment, property development and operations, healthcare (senior-housing) investment, car dealership, general insurance, and a residual "Others" bucket of technology, logistics and food and beverage [1]. What such a company "sells" is not one product but a portfolio of cash flows: a contractor's labour and project delivery, a landlord's rent, a developer's finished flats, a senior-housing operator's beds, a car dealer's vehicles, an insurer's cover, and a warehouse operator's storage. Each has a different customer, a different payer, and a different economic clock.
Because the businesses are unrelated, there is no single "industry" to teach. The organising principle is instead the holding company itself — a parent that allocates capital across arenas that rise and fall on different cycles, and reports one consolidated result that blends them. This tab teaches those arenas: where the revenue sits, where the profit actually pools (rarely the same place), and which structural forces move each one. The reference year is the financial year ended 31 March 2026 (FY2026), when the Group turned a $64 million prior-year loss into a $61 million profit after tax on revenue of $1,052 million [2].
The portfolio: revenue in one place, profit in another
The single most important thing to understand about a diversified holding company is that its revenue mix and its profit mix are two different pictures. Construction and engineering dominates the top line, but the small, capital-heavy property and insurance segments punch far above their revenue weight in profit.
Source: FY2026 Annual Report, Note 5(a) Segment Information — group revenue by segment [3].
Construction and engineering is 56% of group revenue; car dealership, healthcare and property development are each roughly $95–135 million; property investment and insurance are small in revenue. Now hold that against where profit is made. The table below pairs each segment's revenue with its segment profit before net finance costs.
*Segment profit/(loss) before net finance costs, FY2026. Source: FY2026 Annual Report, Note 5(a) Revenue and Results [4].
Property investment is the clearest lesson: on $28 million of rental revenue — under 3% of the group — it earned $27 million of segment profit, nearly as much as the whole construction arm, because a landlord's revenue is almost pure margin and its profit also absorbs fair-value changes on the buildings [10]. Car dealership is the mirror image: $135 million of revenue for $5 million of profit, a wafer-thin 3.6% because vehicle retail is a high-turnover, low-markup trade [13]. A reader who judges this company by its revenue mix will badly misread where its money is made.
Geographically the group is anchored at home: Hong Kong was 63% of total segment revenue in FY2026, Mainland China 16%, and the United States 10%, with the balance spread across Singapore, Macau, Australia, Canada and the UK [9].
The anchor arena: Hong Kong construction and engineering
Construction and engineering (C&E) is the business that most defines the group's cycle, so it is the arena to understand first. The Group defines the segment broadly: aluminium windows and curtain walls, building construction, building supplies, civil engineering, electrical and mechanical (E&M) engineering, environmental engineering, and lifts and escalators [1]. In FY2026 the segment (including its share of associates and joint ventures) generated $724 million of revenue and $54 million of profit before net finance costs, up from $35 million a year earlier as completed projects released cost savings [5].
Who pays, and the public–private split. The defining structural feature of Hong Kong construction is that demand divides sharply between the public and private sectors, and those two clocks are out of phase. Through FY2026 the private sector stayed subdued — new property development slowed and residential inventory overhung the market, so developers deployed capital cautiously — while the public sector carried the industry, supported by a government capital-works programme running at roughly $15.4 billion a year over the next five years, including the multi-decade Northern Metropolis initiative [2]. Management is explicit that "most private-sector projects have been slow… with government-led initiatives remaining the main source of market activity" [8]. For a contractor, this means the public tender pipeline — public housing above all — is the demand engine, and the government is the ultimate payer.
The order book is the leading indicator. Construction revenue is recognised over the life of a contract, so the value of work already won but not yet built — "contracts on hand" — is the forward signal that matters more than any single year's revenue. Chevalier's outstanding C&E contracts stood at $997 million at 31 March 2026, up from $783 million a year earlier, rebuilt through public-housing wins including a December 2025 award for five residential towers in Yau Tong (1,300+ flats) and tenders from the Hong Kong Housing Authority [6].
The technology shift. The arena is being reshaped by prefabrication. Modular Integrated Construction (MiC) — building room-sized modules in a factory and assembling them on site — and its E&M counterpart MiMEP (multi-trade integrated mechanical, electrical and plumbing) are moving from pilots to standard practice, pushed by chronic labour shortages and rising material costs, and by government mandate on public projects. Chevalier used its proprietary "Full MiC" method to deliver over 6,000 Light Public Housing units across three sites within a two-year window [7]. The same forces — labour and material cost inflation, plus robotics and smart-site safety systems — are reshaping how every contractor in the city operates [2].
Peer economics: how the construction players compare
Chevalier's construction segment is only one arm of a conglomerate, so the closest listed comparables are Hong Kong contractors that do this as their whole business. Two are usefully documented in the record: Analogue Holdings (ATAL, HKEX:1977), a pure E&M and smart-city engineering specialist with a 47-year history, and Build King Holdings (HKEX:0240), a building-and-civil contractor. The table below places the three side by side; read it with the comparability caveats that follow.
Sources: Chevalier — FY2026 Annual Report [5], [6]; ATAL — FY2024 results call [18]; Build King — FY2025 results announcement [20], [21].
Comparability limits, stated plainly. These are not clean like-for-like figures. The three companies close their books on different dates (Chevalier at March, the other two at December), and their scope differs: ATAL is E&M-and-technology led, Build King is building-and-civil led, and Chevalier's segment is a mix of both plus façades, lifts and building supplies. Margins are reported on different bases and are not directly comparable — ATAL disclosed a gross margin of 15.5% in FY2024, well above the low-single-digit-to-mid-single-digit range typical of building-and-civil work, reflecting its higher-value engineering mix; Build King reported a 7.5% gross margin in FY2025, down from 8.0%, squeezed by early-stage projects and a lower price-fluctuation index [18] [21]. The comparison teaches structure, not a scoreboard: what all three share is dependence on the same Hong Kong public-works pipeline and the same cost pressures.
The book-to-scale signal. The one number that travels well across the three is contracts on hand relative to annual revenue. Build King's $3.94 billion backlog — roughly two years of revenue — and ATAL's $1.4 billion both dwarf their annual sales, and Chevalier's $997 million is about 1.4× its segment revenue. A large multi-year book is how contractors in this arena convert a lumpy tender market into visible forward revenue; Build King states its backlog "secure[s] the revenue of the Group for the next two years" [21].
Where the peers agree on the arena. All three independently describe the same demand backdrop: ATAL's chairman put Hong Kong government capital works at "$11.5 billion to $15.4 billion" and called himself "cautiously optimistic," and pointed to a broad shift toward data centres, hospitals, environmental engineering and housing [17]. Both ATAL and Chevalier lean on the same prefabrication technologies — ATAL has applied MiMEP or DfMA in more than 50% of its building-services projects and built dedicated MiMEP centres in Zhuhai and Hong Kong [18]. This is the industry's genuine common ground: a public-works-led demand engine, a labour-driven push into factory-made construction, and margins set by input costs and tender competition.
The satellite arenas
The remaining businesses are separate industries with their own economics. Each deserves a short teaching note, because a reader will meet them again in the chapters.
Property — two different businesses under one name. The Group runs both a property investment business (owning and renting offices and commercial buildings in Hong Kong, Mainland China, Singapore, Canada and the UK) and a property development and operations business (building and selling flats, plus cold storage and hotels). They behave nothing alike. Investment property is a recurring-rent, high-margin business whose reported profit swings with fair-value revaluations tied to interest rates and investor sentiment [10]. Development is a lumpy, capital-intensive, inventory-carrying business whose profit turns on how many units sell and whether they must be written down: property development swung from a $36 million segment loss in FY2025 to a $10 million profit in FY2026, driven mostly by lower provisions against Hong Kong development property and Changchun inventory, not by a sales boom [11]. Hong Kong's residential market entered FY2026 stabilising after a prolonged downturn, but developers still faced margin pressure from competitive pricing to clear inventory [24].
Healthcare — US senior housing plus a Hong Kong pioneer. This is a real-estate-backed elder-care business, not a hospital operator. At 31 March 2026 the Group owned 25 senior-housing facilities across six US states — about 2,200 units/beds spanning independent living, assisted living and memory care — run through independent third-party operators, and it has been trimming the portfolio, disposing of its Portland "Laurelhurst Village" facility during the year [12]. In Hong Kong it operates "Ventria Residence," the city's first high-end Continuing Care Retirement Community, combining residential living and healthcare in one purpose-built community [12]. The segment has been the group's most troubled arena: its loss narrowed to $5 million in FY2026 only because a disposal gain and a lower unrealised loss offset the underlying drag [12].
Car dealership — a China EV market in a price war, and a Canada exit. The dealership business retails, trades and services vehicles. In Mainland China (centred on Chengdu) it saw steady growth led by strong electric-vehicle demand, but selling prices came "under significant pressure due to market oversupply and the ongoing structural shift toward electrification"; management frames the industry as consolidating through accelerated electrification, digital transformation and policy-driven consumption [13]. Facing narrowing margins and sustained losses, the Group exited its Canadian dealerships entirely during FY2026 [13].
Insurance — a niche general insurer. The insurance and investment segment writes general (non-life) insurance, with employees' compensation cover as its key line, and runs an investment portfolio of mostly investment-grade fixed income alongside selective private funds. Despite "intense market competition," FY2026 segment profit rose to $19 million on lower net claims and higher investment income — a reminder that an insurer's profit is driven by claims experience and investment returns, not premium growth [14].
Others — cold storage, logistics, technology, food and beverage. The residual segment houses IT-equipment sales and AIoT systems integration, freight forwarding, and food trading and F&B. Its cold-storage and logistics operations illustrate a competitive cold-chain arena: softer demand from restaurant closures and cross-border consumption led clients to cut import volumes, while "intensifying competition within the cold chain industry exerted additional pressure on pricing and margins" [15].
Structural forces that move these arenas
Because the businesses are unrelated, no single force governs the whole company — but a handful of forces each dominate one or more segments. The matrix below is the map.
Sources: FY2026 Annual Report — Letter to Shareholders and MD&A [2], [10], [13], [14].
The force that most distinguishes a conglomerate like this from a focused operating company is the third one: fair-value and provision volatility. A large share of the group's reported profit — or loss — in any year comes not from operating the businesses but from marking assets. In FY2026, non-operating items swung the result: gains on disposal of Canada and US properties, a sharply smaller fair-value loss on investments, and reduced provisions on development property together explain most of the turnaround [2]. The car-dealership segment alone carried a $14 million unrealised investment loss and $6 million of goodwill impairment inside its FY2026 result [4]. For a reader, the practical implication is that this company's earnings are noisier than an operating margin alone would suggest.
Where the cycle sits
Read across five years, the group's arenas moved through a shared downcycle and a FY2026 recovery. Revenue peaked at $1,186 million in FY2025 before easing to $1,052 million in FY2026 as major construction projects completed; profit after tax, however, tells the real cycle story, swinging from positive in FY2023 to two consecutive loss years in FY2024–FY2025 and back to a $61 million profit in FY2026.
Sources: FY2024 Annual Report [16] and FY2026 Annual Report [2] (revenue and profit after tax, as reported; FY2023 restated).
The two loss years were not a construction failure — the C&E segment stayed profitable throughout — but a portfolio phenomenon: FY2024's loss came from provisions on development property, fair-value losses on investments, goodwill impairment and lower investment-property valuations [16], and FY2025 repeated the pattern with heavier healthcare and development write-downs [4]. Group operating margin, on the facts pack's basis, went from -3.2% in FY2025 to +8.2% in FY2026 — an 1,144-basis-point swing far larger than the segment cycle alone, again showing how asset marks amplify the reported result.
The peers triangulate the construction cycle from their own vantage points. Build King, whose year ends in December, paid a special dividend "to ease the burden on most shareholders under the market downturn" in FY2024 and again flagged a lower price-fluctuation index and land-resumption delays pressing its FY2025 building margins [22] [21]. ATAL described "challenges over the past years" but pointed to a rising order book (a 3.6% intake increase) and the still-large public pipeline as reasons for cautious optimism [17]. The consistent read across all three is a construction arena passing the bottom of a private-sector downturn while the public pipeline holds — and, at Chevalier specifically, a rising backlog ($783M to $997M) that lines up with that read [6].
Figures converted from Hong Kong dollars at historical FX rates — see data/company.json.fx_rates for the rate table. Ratios, margins, and multiples are unitless and unchanged.
Competition
Chevalier International is a diversified Hong Kong conglomerate, and only one of its seven reporting segments — Construction and Engineering — sits in an arena where listed rivals report comparable numbers. That segment is also the largest: it generated $586 million, roughly 56% of the Group's consolidated revenue, in the year ended 31 March 2026 [1]. The rest of the portfolio — property, healthcare investment, car dealership, insurance, food and logistics — competes against a different set of players in each market, most of them private or embedded in larger groups; the arena structure of those markets belongs to Industry.
This tab lays out the record where the evidence is citable. The peer set staged for this run names six Hong Kong contractors, but only two carry documents in the corpus: Analogue Holdings (ATAL Engineering, HKEX:1977), a pure-play electrical-and-mechanical engineering group, and Build King Holdings (HKEX:0240), a building-and-civil-engineering contractor. The other four named rivals — Chun Wo (Asia Allied Infrastructure, 0711), Yau Lee (0406), Wai Kee (0610) and China State Construction International (3311) — appear in the selection screen but have no filings or transcripts staged here, so they are named for completeness and not benchmarked. All figures below are as reported; Chevalier closes its year on 31 March, while both documented peers report on a 31 December calendar year.
Where the businesses actually overlap
Chevalier's Construction and Engineering segment is itself a bundle of divisions — building construction, electrical and mechanical (E&M) engineering, lifts and escalators, environmental engineering, aluminium windows and curtain walls, and building supplies [2]. The two documented peers overlap different pieces of it. Build King is a direct rival in building construction and civil engineering; ATAL overlaps the E&M, lifts-and-escalators and environmental-engineering divisions. No documented peer competes in Chevalier's property, healthcare, car dealership or insurance segments.
Source: Chevalier segment composition, FY2026 Annual Report MD&A [2]; peer business descriptions per Build King FY2025 results [3] and ATAL FY2024 results call [4].
Build King describes itself as "principally engaged in building construction and civil engineering works in Hong Kong," providing "a full spectrum of construction services… including building construction, civil engineering, foundation, electrical and mechanical, interior refurbishment and fitting-out works" [3]. ATAL calls itself "a leading provider of electrical and mechanical engineering solutions and information and communications technology services for smart cities," spanning building services, environmental engineering, ICBT and lifts and escalators [4]. Both are Hong Kong-headquartered and bid for the same public and private works Chevalier's construction division targets.
The contested segment inside the whole
Construction and Engineering carries the Group. Its share of consolidated revenue has risen as the property, car dealership and healthcare segments contracted, and it swung the Group back to profit in FY2026 after two loss years.
Source: Chevalier segment information, FY2026 Annual Report MD&A and the FY2024 / FY2022 annual-results announcements, as reported [1]. "Others / insurance" aggregates the Property Investment, Insurance and Investment, and Others segments.
On the wider "total segment revenue" basis that includes Chevalier's share of associates and joint ventures, Construction and Engineering booked $725 million in FY2026 against $857 million in FY2025; the decline reflected "some major projects being substantially completed during the year," while segment profit before net finance costs rose to $54 million from $35 million on completed-project cost savings [1]. The recovery in Group profit was attributed first to "improved contribution from the construction and engineering segment" [1].
Rivals' numbers side by side
The two documented peers are not the same size or shape as Chevalier's construction arm. Build King is a much larger, pure-play contractor — its FY2025 revenue of $1.77 billion is roughly three times Chevalier's consolidated Construction and Engineering revenue — but it runs on a thin construction margin. ATAL is closer in scale to Chevalier's segment and earns a markedly higher gross margin, reflecting its E&M and maintenance mix rather than main-contract building.
Sources: Chevalier consolidated C&E revenue and outstanding-contract value, FY2026 MD&A [1] [5]; Build King FY2025 revenue, margin and contracts on hand [6] [7]; ATAL FY2024 revenue, margin and contracts in hand [8]. Chevalier revenue is a group segment; peers are whole listed companies with 31 December year-ends. Chevalier does not disclose a segment gross margin.
Build King's gross margin has been sliding: 10.4% in 2023, 8.0% in 2024, and 7.5% in the year to December 2025, the last step attributed partly to "a decrease in the price fluctuation index" and to newly awarded projects still at early stages [6] [7]. ATAL, by contrast, reported a 2024 group gross margin above 15%, lifted by recurring maintenance revenue and its lifts-and-escalators business [8]. The contrast is the standard one in Hong Kong contracting: main-contract building work is high-revenue, low-margin, while E&M and maintenance carry higher margins on lower volume.
Backlog — the forward book
In a project business, the order book is the clearest read on forward competitive position. Chevalier disclosed $999 million of outstanding construction and engineering contracts at 31 March 2026, up from $784 million a year earlier [5]. Build King reported $3.9 billion of contracts on hand, which it says "secure the revenue of the Group for the next two years" [7]; a year earlier the figure was $4.1 billion [9]. ATAL reported contracts in hand "just over $1.4 billion" at the end of 2024 [8].
Sources: Chevalier at 31 March 2026 [5]; Build King at end-2025 [7]; ATAL at end-2024 [8]. Chevalier and ATAL figures cover their engineering activities; Build King's is the whole company.
Chevalier's book grew 27% year on year even as segment revenue fell, driven by new residential-construction wins — the December 2025 award of five residential towers in Yau Tong, "further consolidating our construction division's solid market position in Hong Kong's public and residential construction sector" [2]. Build King's book, three to four times larger, edged down from $4.1 billion to $3.9 billion, with management flagging "delays in certain newly awarded projects caused by slow land resumption" [7].
The shared driver: Hong Kong public works
All three companies are pointed at the same demand pool. Chevalier frames the opportunity as the Government's "annual capital works expenditure of approximately HK$120 billion over the next 5 years, including major projects under the Northern Metropolis initiative" (about $15 billion a year) [10]. ATAL's chairman cited the identical envelope — "the government capital works program alone still stands at [HK]$90 billion to $120 billion," roughly $12 billion to $15 billion — as the anchor for its "cautiously optimistic" stance [11]. Both point to the public pipeline because private-sector construction has been weak: Chevalier notes "most private-sector projects have been slow over the past year, with government-led initiatives remaining the main source of market activity" [12].
That concentration on public tenders is where competition is most direct. Chevalier's lift-and-escalator division reported "successfully securing several tenders from the Hong Kong Housing Authority during the year" [12] — the same public-housing client base ATAL and other E&M contractors chase.
Technology as the competitive lever
Both Chevalier and ATAL position modern methods of construction — modular integrated construction (MiC) and multi-trade integrated mechanical, electrical and plumbing (MiMEP) — as the differentiator in a labour-short market. Chevalier completed three large-scale Light Public Housing projects "that applied MiC and Multi-trade Integrated Mechanical, Electrical and Plumbing (MiMEP) technologies" and delivered over 6,000 units in two years using its "proprietary Chevalier Full MiC Solution" [12] [1].
ATAL makes a stronger claim on the same ground. Its management said it had "successfully implemented MiMEP and other construction technology like DfMA… in more than 50% of our building service project," describing itself as "an industrial pioneer in the adoption of advanced construction technology" [13]. ATAL also cites 61 international patents and a 47-year track record as competitive assets [4]. Both firms compete on the same technology narrative; the disclosed adoption rates are not stated on a comparable basis.
How management characterizes competition
Chevalier's own filings repeatedly describe its markets as competitive, in the construction segment and beyond it. In FY2022, the Construction and Engineering segment's profit before finance costs fell 28.6% — from $60 million to $43 million — attributed "mainly [to] the fierce competition in the industry," alongside the absence of one-off government subsidies and cost inflation [14]. The insurance business is described as "a fiercely competitive business in Hong Kong" [15], and in FY2026 the Insurance and Investment segment operated amid "intense market competition" [16]. The car dealership segment faced a distinct pressure: in the Chinese Mainland, "vehicle selling prices came under significant pressure due to market oversupply and the ongoing structural shift toward electrification" [17].
The documented peers describe the same downturn in blunter terms. Build King, declaring an extra payout in its FY2024 results, said the board would "distribute an additional special dividend of HK6.0 cents per ordinary share to ease the burden on most shareholders under the market downturn" [18]. ATAL's chairman acknowledged "there have been challenges over the past years, well, with COVID-19 followed by economic downturn," while pointing to a "very high level of contract in hand" and a 3.6% increase in order intake in 2024 [11]. Neither documented peer names Chevalier in its filings — unsurprising given both lead their respective niches and Chevalier's construction arm is one of many mid-sized contractors bidding the same public works.
Customer concentration and switching
Chevalier's construction and E&M work is tendered project by project, so competitive position is re-contested at each award rather than protected by long-term recurring contracts. The Group's five largest customers accounted for about 33.7% of FY2026 revenue, with the largest single customer — an independent third party — at about 14.2% [19]. That concentration is moderate for a project contractor and reflects the segment's reliance on large public-works clients such as the Housing Authority and Drainage Services Department.
Sources: FY2026 MD&A on divisional contract structures and the five-year Sik Sik Yuen property-management partnership [20]; customer-concentration disclosure [19]. Switching characterizations are the analyst's read of the disclosed contract types, not a stated Chevalier metric.
The one place Chevalier's construction segment holds recurring, stickier revenue is lift-and-escalator maintenance and, newly, property management: in September 2025 it entered "a strategic five-year partnership with Sik Sik Yuen… to manage four LPH projects totalling 452 housing units" [20]. This mirrors ATAL's structural advantage, where recurring maintenance revenue underpins its higher margin. The bulk of Chevalier's construction revenue, however, is non-recurring tendered work with no exclusivity — replacement is the default at project completion, not the exception.
What the record shows, in brief
The competitive record for Chevalier reduces to its Construction and Engineering segment, where two listed rivals are documented. Build King is three-to-four times larger by revenue and backlog but earns a construction margin under 8% that is still falling; ATAL is closer to Chevalier's engineering scale and earns a double-digit margin off E&M and maintenance. All three depend on the same Hong Kong public-works pipeline of roughly $12–15 billion a year, compete on the same MiC/MiMEP technology narrative, and win work through repeat tendering rather than locked-in contracts. Chevalier's order book grew 27% into FY2026 while the segment's revenue fell — a divergence worth tracking. The Group's other segments face real competition — "fierce" and "intense" in its own words — but no documented listed peer, so those arenas are laid out in Industry rather than benchmarked here.
Figures converted from Hong Kong dollars at historical FX rates — see data/company.json.fx_rates for the rate table. Ratios, margins, percentages, share counts, and multiples are unitless and unchanged.
History
Chevalier International Holdings began in 1970 as a ten-person Toshiba lift-and-escalator agency in Tsim Sha Tsui and is today a Bermuda-incorporated, Hong Kong-listed conglomerate spanning construction and engineering, property, US senior housing, car dealerships, insurance, and investment [1]. The indexed primary record here runs from the FY2022 annual report (year ended 31 March 2022) through the FY2026 annual report (year ended 31 March 2026), with five annual reports and three interim reports. Within that window the record has one clear break: two consecutive loss-making years, FY2024 and FY2025, driven not by the operating businesses but by investment fair-value losses and property provisions, followed by a reported turnaround to profit in FY2026 [2]. This tab records the dated beats, what management said against what happened, how capital was allocated, and how the explanation for the losses shifted year to year. It does not argue whether that record is good or bad.
The long arc: founding to today
The founding facts are drawn from the corporate website rather than a filing, so they are recorded here as company-stated history, not audited fact.
| Year | Event |
|---|---|
| 1970 | Founded by the late Dr Chow Yei Ching (1935–2018) as the sole Hong Kong distributor of Toshiba lifts and escalators, starting at Star House, Tsim Sha Tsui [1] |
| 1984 | Chevalier (HK) Limited listed on the Stock Exchange of Hong Kong [1] |
| 1989 | Chevalier International Holdings Limited replaced Chevalier (HK) Limited's listing (stock code 25) [1] |
| 2009 | Expanded the Toshiba relationship into a lifts-and-escalators joint venture for installation, maintenance and modernisation [3] |
| 2011 | Entered the US senior-housing business [3] |
| 2021 | First Modular Integrated Construction ("MiC") project [1] |
| 2024 | Completed its first Full MiC project, "Chung Yuet Lau" in Sha Tin, a 10-storey, 64-unit Housing Society building [4] |
| 2025 | 55th anniversary; board reshuffle and completion of Hong Kong's first Light Public Housing project [5] |
Source: corporate website milestones [1]; FY2024–FY2025 annual reports [4] [5].
Who runs the company today, and their incentives, belong to People; the named-competitor record belongs to Competition. This tab stays with what happened and when.
Five years of results, in the record
The indexed filings cover ten fiscal years of income-statement history and five years of full annual reports. Revenue grew from $611 million in FY2017 to a $1.19 billion peak in FY2025, then fell to $1.05 billion in FY2026 [6]. Net income, however, broke the pattern: after eight profitable years, the group reported losses in FY2024 and FY2025 before returning to profit in FY2026.
Source: consolidated income statements, FY2018–FY2026 annual results [6] [7].
The two loss years share a signature: revenue kept rising while profit turned negative. Construction and engineering — the largest segment — stayed profitable throughout. The losses came from below the operating line, in investment marks and property provisions, which the next sections trace.
FY2026 Net Profit ($M)
FY2025 Peak Revenue ($M)
FY24–25 Cumulative Loss ($M)
Consecutive Years Paying Dividends
Source: FY2022–FY2026 annual reports; dividends declared every year in the covered window [8].
Said versus did: guidance, targets, and outcomes
Chevalier hosts no analyst earnings calls and issues no numeric revenue or profit guidance; its forward statements are the qualitative commitments in the chairman's Letter to Shareholders and the operating targets in the MD&A. The ledger below pairs each year's stated commitment or expectation with the outcome the record later showed. Because the company sets no quantitative guidance, "measurement basis" is the qualitative claim, and the outcome is the next filing's report.
Source: chairman's letters and MD&A, FY2022–FY2026 annual reports [9] [10] [11] [2].
One pattern is worth recording plainly. In FY2022 and again in FY2023, management attributed steady construction-segment profit partly to non-recurring government subsidies — one-off items that, by definition, could not repeat [9] [10]. When those cushions were gone and property/investment marks turned against the group, the reported result fell to a loss.
The loss years, and the explanation that shifted
The clearest thing to record about FY2024 and FY2025 is that the operating businesses did not cause the losses — investment marks and property provisions did — and that management's inventory of causes changed each year. The chart isolates the recurring below-the-line items management itself named as the drivers.
Source: Financial Review, "Other (losses)/gains, net", FY2024–FY2026 annual reports [7] [12] [6].
The paired quotes below track how the account of the losses moved from FY2024 to FY2026. Each is dated to its filing and page.
FY2024 — four causes named: the loss "was mainly due to the recognition of (i) provision for properties under development; (ii) loss on investments at fair value through profit or loss; (iii) impairment loss on goodwill; and (iv) decrease in the fair value of certain investment properties."
FY2025 — two causes named: the loss "was mainly due to the recognition of loss on investments at fair value through profit or loss of the Group and the provision for properties under development of the Group."
FY2026 — five causes of turnaround named: profit "was mainly attributable to (i) improved contribution from the construction and engineering segment; (ii) gains on disposal of properties located in Canada and the US; (iii) significant reduction in the net fair value loss on investments; (iv) a reduction in the provision on properties under development; and (v) a reduction in the provision on properties for sale."
Source: MD&A opening paragraphs, FY2024 [13], FY2025 [14], FY2026 [2].
Two features of that drift are facts, not verdicts. First, the goodwill impairment named in FY2024 ($12 million against the senior-housing business) shrank to $4 million in FY2025 and disappeared as a headline cause by FY2026 [7] [12]. Second, the net fair-value loss on investments grew before it shrank — $19 million in FY2024, $41 million in FY2025, then $13 million in FY2026 — so the item management de-emphasised in wording (dropping "goodwill" and "investment properties" from the FY2025 headline) was in fact the item that worsened most that year [12].
The macro framing also stayed remarkably constant. Across FY2024, FY2025 and FY2026, the chairman opened with the same catalogue — geopolitical tension, high interest rates, trade and tariff frictions, an uneven Hong Kong recovery — while the specific outcome under it moved from loss to loss to profit [11] [15] [16].
Capital allocation: the dividend, the buyback, and the disposals
Chevalier's capital-allocation record in this window is dominated by one continuity and a handful of discrete events. The continuity is the dividend, paid in every covered year — including both loss years. The dividend was, however, cut sharply as profits fell: from HK$0.50 per share for FY2022 to a low of HK$0.16 for FY2025, before being raised to HK$0.30 for FY2026 alongside the return to profit. In US-dollar terms those payouts run from about $0.064 to a low of $0.021, then back to $0.038 per share.
Source: dividend notes, FY2022–FY2026 annual reports [17] [18] [19] [20] [8].
That the board sustained a dividend through two loss years is a recorded choice, not an endorsement of it. The company paid $0.026 per share (FY2024) and $0.021 per share (FY2025) while reporting net losses — funded from reserves and a strong cash and property base rather than the year's earnings.
The one buyback in the record is small and precisely dated. In September and October 2024 (FY2025), the company repurchased 660,000 shares for about $0.41 million in aggregate; all were cancelled. The board's stated rationale was that "the trading price of the shares did not reflect their intrinsic value and business prospects" [21]. No buybacks occurred in FY2026 [22]. Against a share count of roughly 301.9 million, the repurchase reduced shares by about 0.2% — a token, not a program.
The ledger below records the discrete capital events the filings disclose, with stated objective and outcome. Where economics are not disclosed, they are marked, not estimated.
Source: FY2025–FY2026 Reports of the Directors and Financial Reviews [21] [6] [23].
Two capital-allocation figures deserve a plain caveat. The FY2026 disposal gains — $18 million on assets held-for-sale and $16 million on the acquisition of a loan from a non-controlling interest — are the gains booked, not the cash received; the filings disclose the accounting gains but not the underlying consideration [6]. A reader cannot compute a return on those transactions from the disclosed record.
Net debt: from net cash to leverage and back
Net debt is the clearest single quantitative record of the cycle. The group held a net-cash position through FY2022 ($138 million net cash), levered up during the loss years to peak net debt of $157 million in FY2025, then swung back to $220 million net cash in FY2026 as it repaid borrowings and banked disposal proceeds.
Source: derived from reported total debt and cash, FY2020–FY2026 (ratios.json); FY2026 financing detail from the consolidated cash-flow statement [24].
The swing to net cash in FY2026 was mechanical: the group repaid $271 million of borrowings against $134 million drawn, a net $137 million reduction in financing, aided by disposal proceeds and a return to positive operating cash [24]. Finance costs fell accordingly, from $33 million to $25 million [23].
Restatement on the record
One accounting restatement sits in the covered window. The FY2024 annual report presents the FY2023 comparative revenue as "restated" — $913 million versus the $909 million originally reported for FY2023 — and restates the FY2023 gross margin and attributable profit accordingly [25]. The restatement is disclosed but modest; it is recorded here so the year-on-year figures in this tab tie to the as-filed comparatives.
Leadership change on the record
The one dated leadership event in the window is the January 2025 board reshuffle, disclosed in the FY2025 letter: Mr. Chow Vee Tsung, Oscar was appointed Vice Chairman and re-designated executive director, and Mr. Tam Kwok Wing was appointed Managing Director, both effective 1 January 2025; long-serving executive director Mr. Ho Chung Leung retired after the August 2025 AGM, ending 40 years of service [5]. The reshuffle immediately preceded the FY2026 return to profit; the record shows the sequence but does not establish that one caused the other. Who these individuals are and how they are incentivised is People's ground.
Figures converted from Hong Kong dollars at historical FX rates — see data/company.json.fx_rates for the rate table. Ratios, ownership and vote percentages, share counts, dates, and quoted plan terms are unitless or unchanged.
Control, operators, and pay
Chevalier is a founder-controlled Hong Kong conglomerate whose control question is unusually literal: 62.90% of the shares — 189,490,248 of them — sit in the unadministered estate of the late founder Dr. Chow Yei Ching, frozen pending a probate action that has run since 2019 [1]. The operating company is run by long-tenured executives — Chairman Kuok Hoi Sang joined the group in 1972 — none of whom personally own more than a fraction of a percent [2]. Pay is entirely cash: there is no share-option or share-award scheme, no performance-vesting equity, and no bonus line for executive directors. What follows maps who controls the votes, who runs the businesses, what they are paid, and the dated governance facts an outside minority holder needs.
The control block: 62.90% held by a contested estate
Chevalier has a single class of ordinary shares ($0.16 par, 301,268,440 issued), so votes track economics one-for-one [3]. The concentration is at the top: a single 189,490,248-share parcel — 62.90% — is registered to the deceased founder, Dr. Chow Yei Ching, with his spouse Ms. Miyakawa Michiko deemed interested in the same block [1].
Source: FY2026 Annual Report, Substantial Shareholders' and Directors' Interests [1]; Ms. Chow Wai Wai, Violet's 14,551,162 own-name shares [4]; directors' personal holdings [2]. Public float is the residual and includes the estate interest that Ms. Chow Wai Wai and Ms. Chow Vi Vi also report as executrices.
The block has actually grown as a percentage without anyone buying a share: it was 62.76% through FY2022–FY2024, then rose to 62.90% after the company repurchased and cancelled 660,000 shares in FY2025, shrinking the denominator [3]. The company confirms public float exceeded 25% as at 29 June 2026 [5].
The probate overhang — an unresolved docket at the top of the register
The controlling stake is the subject of High Court Probate Action HCAP 22/2019, which turns on two competing wills of the late Dr. Chow (dated 27 April 2009 and 29 October 2015). Both are "subject to the determination" of that action, and the outcome will decide who ultimately controls the block [6].
The dispute reaches into the boardroom. Executive Director Miss Lily Chow reported the 189,490,248 shares as a named executrix. But the company records a Court of Appeal reference — CAMP 202/2021 [2023] HKCA 167, dated 8 February 2023 — to the effect that any representation by Miss Lily Chow that she acts as an executrix "would not be correct after 29 June 2021," because she has stated in her own court pleading that she does not intend to accept the executrixship of the 2015 will pending judgment [6]. Two other members of the founding family — Ms. Chow Wai Wai, Violet and Ms. Chow Vi Vi — each separately report an interest in the same shares as executrices of the estate; Ms. Chow Wai Wai additionally holds 14,551,162 shares (4.83%) in her own name and through wholly-owned companies [4].
The single largest ownership fact — who controls 62.90% of Chevalier's votes — is the subject of a probate action running since 2019 among the founder's heirs, with no disclosed resolution date. That the company's own filing flags a Court of Appeal finding on one director's stated executrix capacity is a governance fact a minority holder should carry, not a settled matter.
Source: FY2026 Annual Report, Directors' and Substantial Shareholders' Interests [6] [4].
What a minority holder can and cannot influence follows from the arithmetic. Whoever ultimately takes the estate block commands an outright majority of the vote at general meetings; the public float, above the 25% minimum, cannot carry an ordinary resolution against it. All resolutions are decided by poll, and independent directors with no interest must be present where a controller or director has a material conflict — the mechanism, but not a swing vote [7].
The board and its committees
As at the date of the FY2026 report the board is eight directors — four executive, four independent non-executive — after two executive departures during the year (below). The only disclosed inter-board family tie is that Vice Chairman Oscar Chow and Executive Director Lily Chow are siblings, both children of the late founder [8].
Source: FY2026 Annual Report — board composition [8]; Management Profile pp.32–37 [9] [10]; Audit and Remuneration Committees [11]; Nomination Committee [12]. "Joined group" is the year the director joined the Chevalier Group or Company as disclosed, not board-appointment date.
Two observations sit alongside the disclosed independence. First, the board designates all four non-executive directors as independent and confirms it received annual independence confirmations under Listing Rule 3.13 [13]. Second, as an observed fact, the audit committee is composed entirely of independent directors and chaired by Ms. Kwan Angelina Agnes — a Harvard-trained lawyer and CPA whose prior roles include senior compliance and enforcement posts at HKEX and the SFC [10]. The remuneration and nomination committees, by contrast, each seat executive directors alongside independents, and the nomination committee is chaired by the executive Chairman himself [11] [12].
Committee membership, disclosed versus composition:
| Committee | Chair | Independent members | Executive members |
|---|---|---|---|
| Audit | Kwan (INED) | Poon, Sze, Sun | — |
| Remuneration | Poon (INED) | Kwan, Sun | Kuok, Oscar Chow |
| Nomination | Kuok (Executive Chairman) | Poon, Sze, Kwan | — |
| ESG | Tam (Executive MD) | — | — |
| Executive | Kuok (Executive Chairman) | — | executive directors |
Source: FY2026 Annual Report, Board Committees pp.46–50 [11] [12].
Board and committee attendance was full or near-full: the board met four times and every director attended at least three of four, with the two departing executives the only sub-full records [14]. During the year 25% of directors were female [12].
Operators — long tenure, a recent reshuffle, and a chair/CEO split only from 2025
The executive bench is deep in years of service but concentrated in age. Chairman Kuok Hoi Sang (76) has been with the group since 1972 and leads the construction and E&M engineering operations [9]. Managing Director Tam Kwok Wing (65), group member since 1986, runs cold storage/logistics, insurance, property and travel [15]. Vice Chairman Oscar Chow (52), an Oxford-trained engineer and the founder's son, assists the Chairman on strategy, finance and risk [9].
Source: FY2026 Annual Report, Management Profile pp.32–37 [9] [16] [10]. Ages as disclosed in the FY2026 report.
The chairman and chief-executive roles were separated only recently. Through FY2024, Kuok Hoi Sang held both Chairman and Managing Director; the company explained the combination under Code Provision C.2.1 as providing "strong and consistent leadership" [17]. With effect from 1 January 2025, Kuok continued as Chairman, Tam Kwok Wing was appointed Managing Director, and Oscar Chow was re-designated from non-executive to executive director and made Vice Chairman [18]. The company uses "Managing Director" rather than "CEO," and there is no separately titled chief executive.
Two executive directors then left in short order:
| Director | Change | Effective date |
|---|---|---|
| Ho Chung Leung | Retired as Executive Director | 27 August 2025 |
| Ma Chi Wing | Resigned as Executive Director | 1 February 2026 |
Source: FY2026 Annual Report — attendance notes p.44 and Directors' Interests p.61 [14] [6].
On the independent side, Mr. Yang Chuen Liang, Charles retired as an independent director on 28 August 2023 [19], and Ms. Kwan Angelina Agnes joined the same year and took the audit-committee chair [10]. The most senior independent director, Professor Poon Chung Kwong (86), has served since 2012 — beyond nine years, which subjects his re-election to a separate shareholder resolution — and sits on the boards of Henderson Land and Hong Kong & China Gas [16]. Succession depth below the founding generation is not disclosed; the nomination committee states it reviews succession "in particular the chairman and the managing director" but names no successor [12].
Incentive architecture — all cash, no equity, no disclosed hurdles
What compensation pays for is simple to describe because there is so little machinery: Chevalier operates no share-option or share-award scheme, and executive-director pay carries no bonus, no equity, and no disclosed performance metric, hurdle, or vesting condition. Directors' emoluments are salary plus retirement-scheme contributions; independent directors receive a fixed fee only [20].
Source: FY2026 Annual Report, Note 40 Directors' Emoluments — FY2026 p.222 [20] and FY2025 comparatives p.223 [18]. Oscar Chow's FY2025 figure covers only the executive portion from 1 January 2025; he received a separate $0.04 million director's fee earlier in that year. Ma Chi Wing and Ho Chung Leung FY2026 figures are part-year.
Total directors' emoluments were $6.4 million in FY2026 (FY2025: $5.9 million), of which the Chairman alone took $2.4 million — roughly 37% [20]. Independent directors were paid fixed fees of $0.06–0.07 million each [20]. The one place a performance-linked bonus appears is below board level: of the five highest-paid individuals, three are directors and two are employees, and those two employees earned $1.8 million combined, including a $0.8 million performance-based bonus — a structure executive directors themselves do not have [21].
Total director emoluments ($M, FY2026)
Chairman share of director pay
Directors' equity / options outstanding
Source: FY2026 Annual Report, Note 40 [20]. "None" reflects the absence of any share-option or share-award scheme in the report; there were no potential dilutive shares in issue [22].
With no equity in the pay mix, the controller's and executives' economic return runs through the ordinary dividend. Chevalier declared a $0.01 interim plus a proposed $0.03 final for FY2026 — $0.04 per share in total, up from $0.02 in FY2025 [22]. On the 62.90% estate block, that FY2026 declaration represents roughly $15 million of dividends flowing to a single, contested holding — the practical way value reaches the control party in the absence of any incentive equity.
Insider activity — negligible dealing, a small cancelled buyback
Dated insider dealing is minimal. Executive directors hold only token personal stakes — Kuok 173,460 shares (0.06%), Tam 249,848 including family (0.08%), and the now-retired Ho 40,000 (0.01%) — and no director purchases, sales, or option exercises are disclosed for the year [2]. At the company level, the only equity transaction was the FY2025 repurchase and cancellation of 660,000 shares for roughly $0.4 million; no shares were repurchased in FY2026 [3]. No arrangement existed during the year to enable directors to acquire shares or debentures [4].
Related-party ledger — recurring associate and joint-venture flows
Chevalier's related-party activity runs through its associates and joint ventures rather than the controlling family directly, and the company states none of it was classified as a connected transaction under Chapter 14A of the Listing Rules [2]. The material recurring lines under Note 45:
Source: FY2026 Annual Report, Note 45 Related Party Transactions [23].
The flows are two-directional and stable year on year: Chevalier earns fee, rental and marketing income from its associates and joint ventures (led by $5.5 million of sales-and-marketing income and $3.1 million of rental income), while paying an associate for construction/maintenance work — the contract fee to an associate rose to $3.5 million in FY2026 from $1.2 million [23]. The company states these were on mutually agreed terms and that no director had a material interest in any significant transaction with the group during the year [21].
What the record leaves open
Three company-specific questions the record surfaces but does not resolve, for the chapters to weigh:
- The probate endgame. HCAP 22/2019 has been live since 2019 with no disclosed timetable. Who inherits the 62.90% block — and whether the estate is ever administered — is the governing uncertainty over control, and a change could reshape strategy, dividend policy, or the register itself.
- Succession under an aging bench. The Chairman is 76 and joined in 1972; the longest-serving independent director is 86. The recent chair/MD split and two 2025–26 executive exits reshuffled the top, but no next-generation operator outside the founding family is named.
- The pay-versus-performance gap. Executive directors carry no equity and no disclosed bonus, yet the two highest-paid non-director employees do earn performance bonuses. Whether all-cash, hurdle-free director pay aligns the operators with minority holders — or simply with the controlling estate's dividend — is a question the disclosure does not answer.
Chevalier International Holdings Limited's annual reports contain management's most considered account of the business. These are the sections, passages and visual pages worth opening in the originals preserved in Sources.
Chevalier International Holdings — FY2025/26 Annual Report — FY2026 (year ended 31 March 2026)
Latest report; documents a turnaround to HK$473m profit after a HK$503m loss, with a Canada car-dealership exit and US senior-housing disposals. · Open the full document →
Business Segments Overview — p. 4 · Read the full section →
One-page map of the seven businesses that make Chevalier a conglomerate — the anchor for reading everything that follows.
Financial Summary — Five-Year Record — p. 5 · Read the full section →
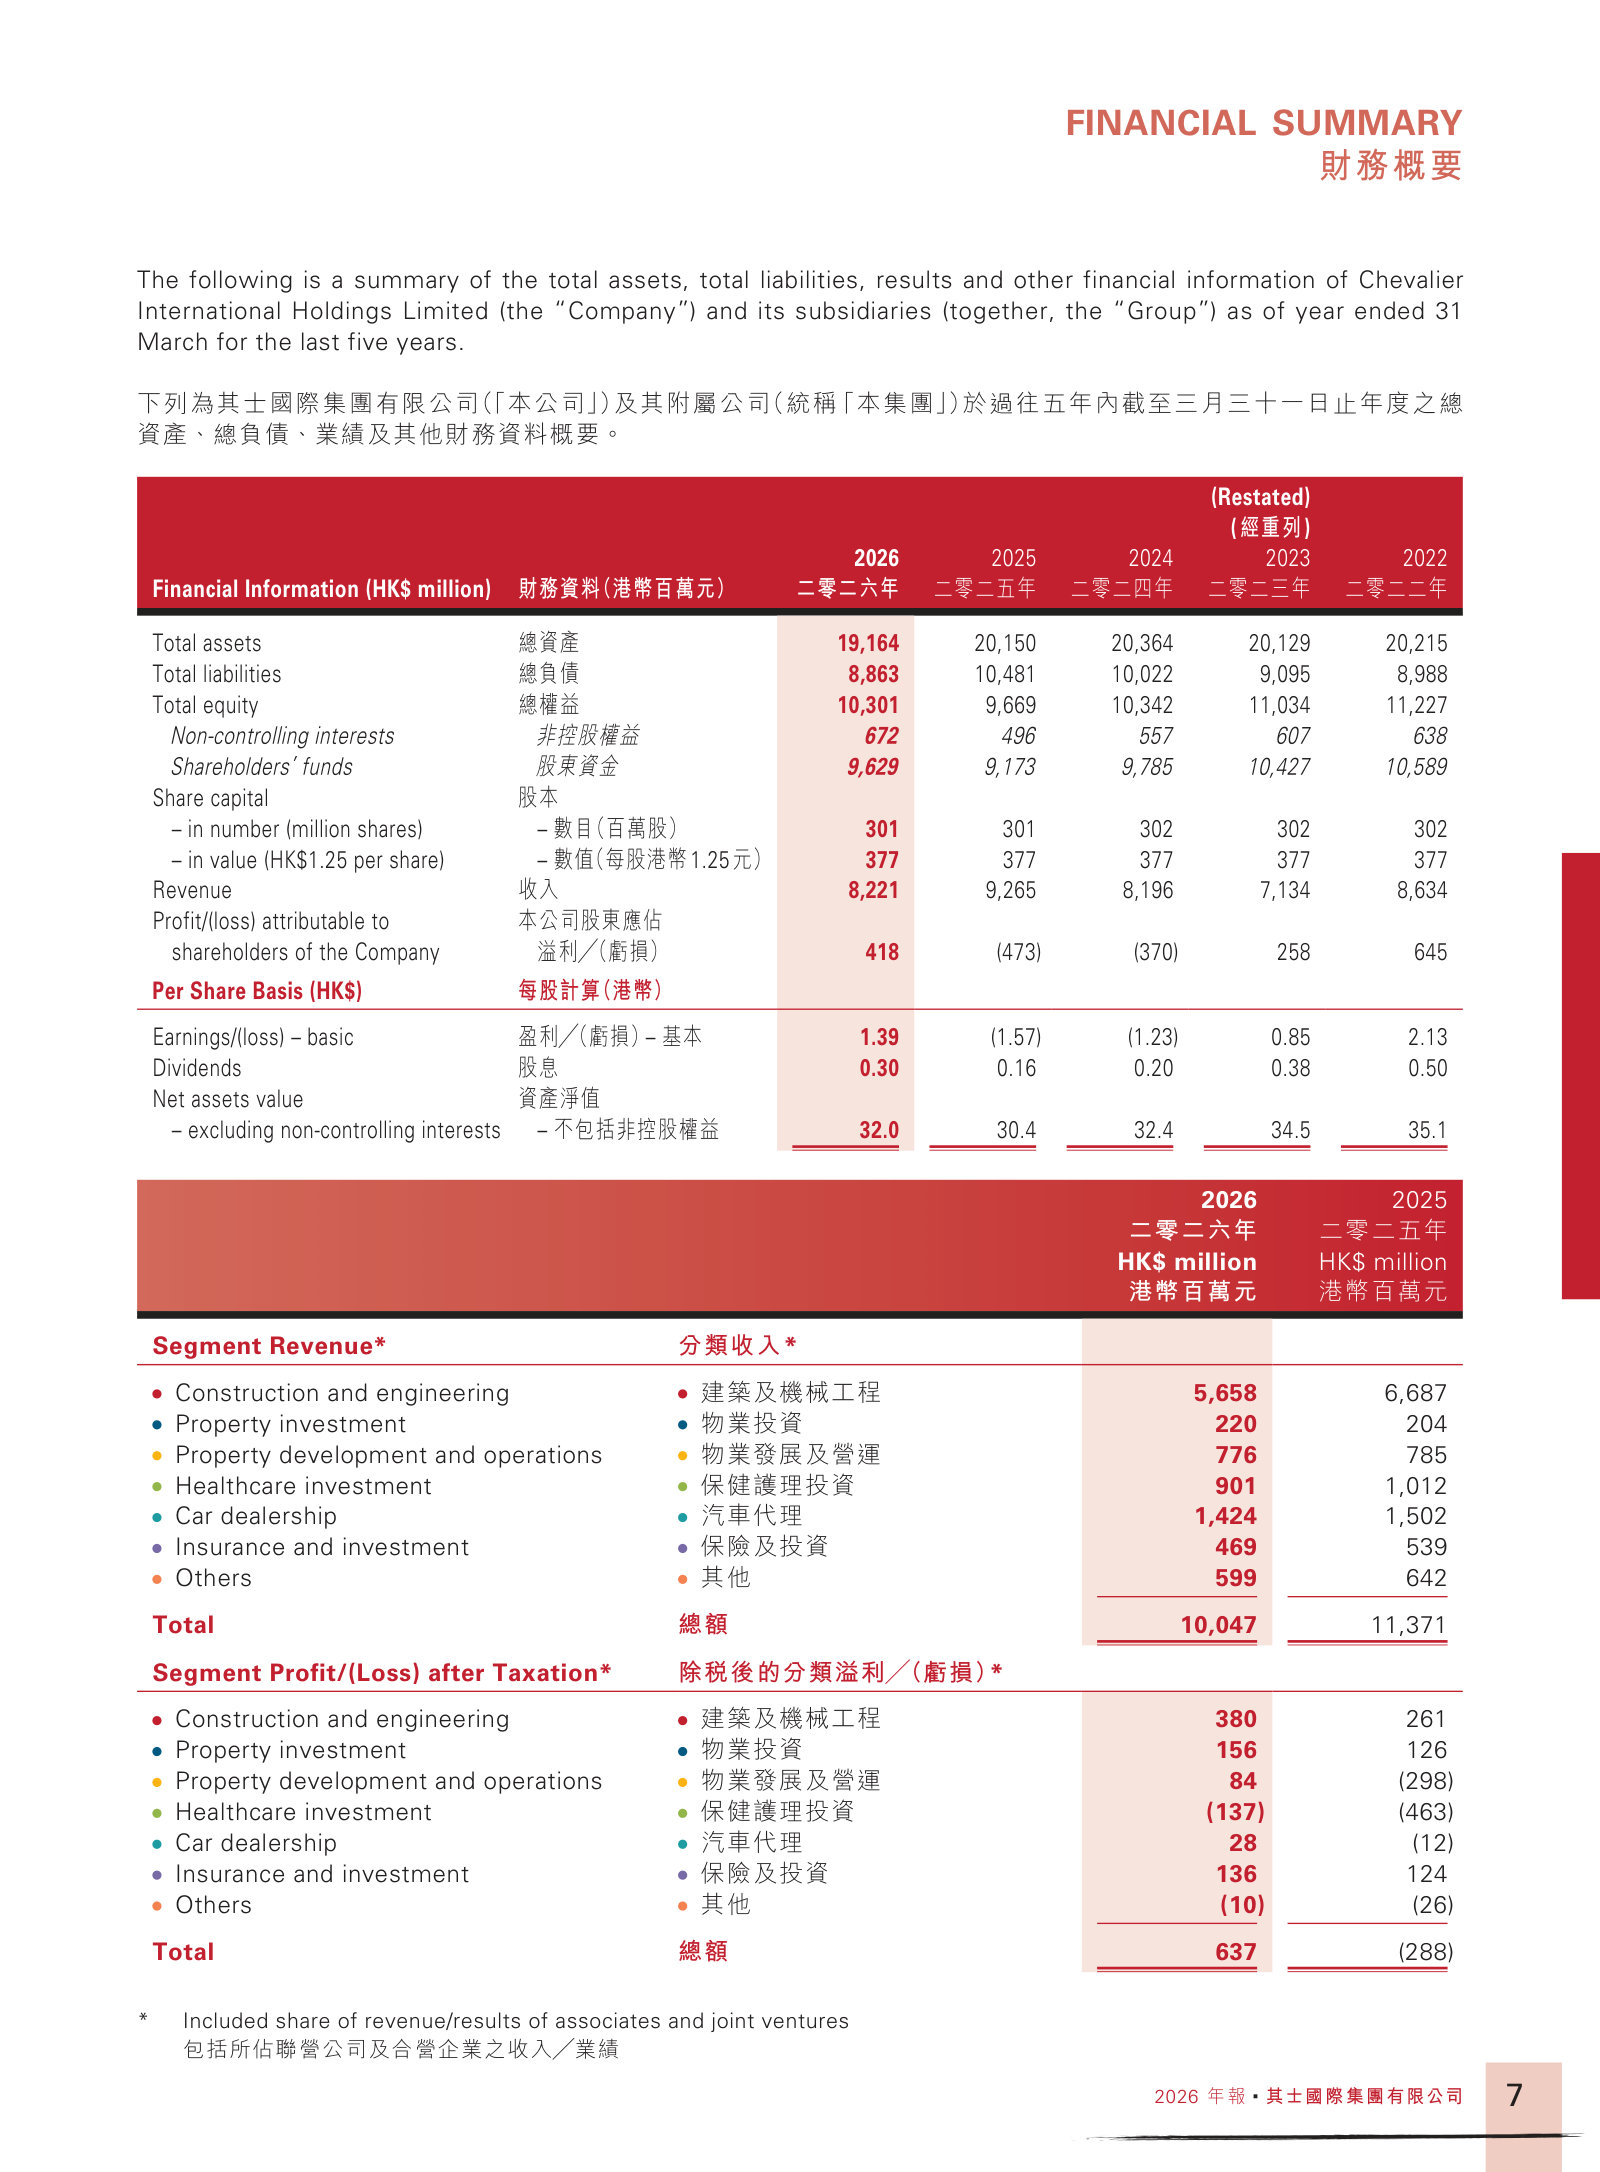
Shows how flat revenue masks a swing from two loss years back to profit; the five-year table sets the base rates.
FY2026 headline metrics: revenue down 11%, but profit swings positive and dividend nearly doubles.
REVENUE
收入
HK$ 港幣
8,221 million 百萬元
11.3% Decrease from 2025
p. 5 · Read in context →
Management Discussion and Analysis — p. 16 · Read the full section →
Management's own account of the turnaround — the five drivers that flipped a HK$503m loss to a HK$473m profit.
The turnaround, in management's words: five drivers behind the return to profit.
The consolidated results recorded a substantial turnaround, mainly attributable to (i) improved contribution from the construction and engineering segment; (ii) gains on disposal of properties located in Canada and the US; (iii) significant reduction in the net fair value loss on investments at fair value through profit or loss; (iv) a reduction in the provision recognised on properties under development; and (v) a reduction in the provision on properties for sale to net realisable value.
p. 16 · Read in context →
Construction & engineering — the largest segment: revenue fell but profit rose on cost savings.
The Construction and Engineering segment recorded revenue of HK$5,658 million for the year ended 31 March 2026 (2025: HK$6,687 million). The decline in segment revenue was mainly due to some major projects being substantially completed during the year. Segment profit before net finance costs amounted to HK$421 million (2025: HK$276 million). Significant improvements in segment profit are mainly due to cost savings from various completed projects.
p. 16 · Read in context →
MD&A — Car Dealership — p. 23 · Read the full section →
The clearest example of active portfolio pruning: Chevalier exited its loss-making Canadian car-dealership business entirely this year.
Strategic exit from Canada's car business amid narrowing margins and sustained losses.
The automotive market in Canada faced challenges during the year, including rising interest rates and increasing new vehicle prices, which dampened consumer demand. Amid narrowing profit margins and sustained losses in the car dealership segment, the Group strategically exited its car dealership operations during the fiscal year, including related repair and maintenance services, as well as its real estate properties in Ontario, Canada.
p. 23 · Read in context →
Financial Review — Consolidated Income Statement — p. 26 · Read the full section →
Line-by-line bridge of the profit recovery; gross margin nearly doubled even as revenue fell.
Gross margin jumped from 6.9% to 11.0% despite lower revenue.
Gross profit increased from HK$639 million in the year 2024/25 to HK$908 million in the year 2025/26 and gross profit margin increased from 6.9% to 11.0%.
p. 26 · Read in context →
Financial Review — Leverage Ratios — p. 30 · Read the full section →
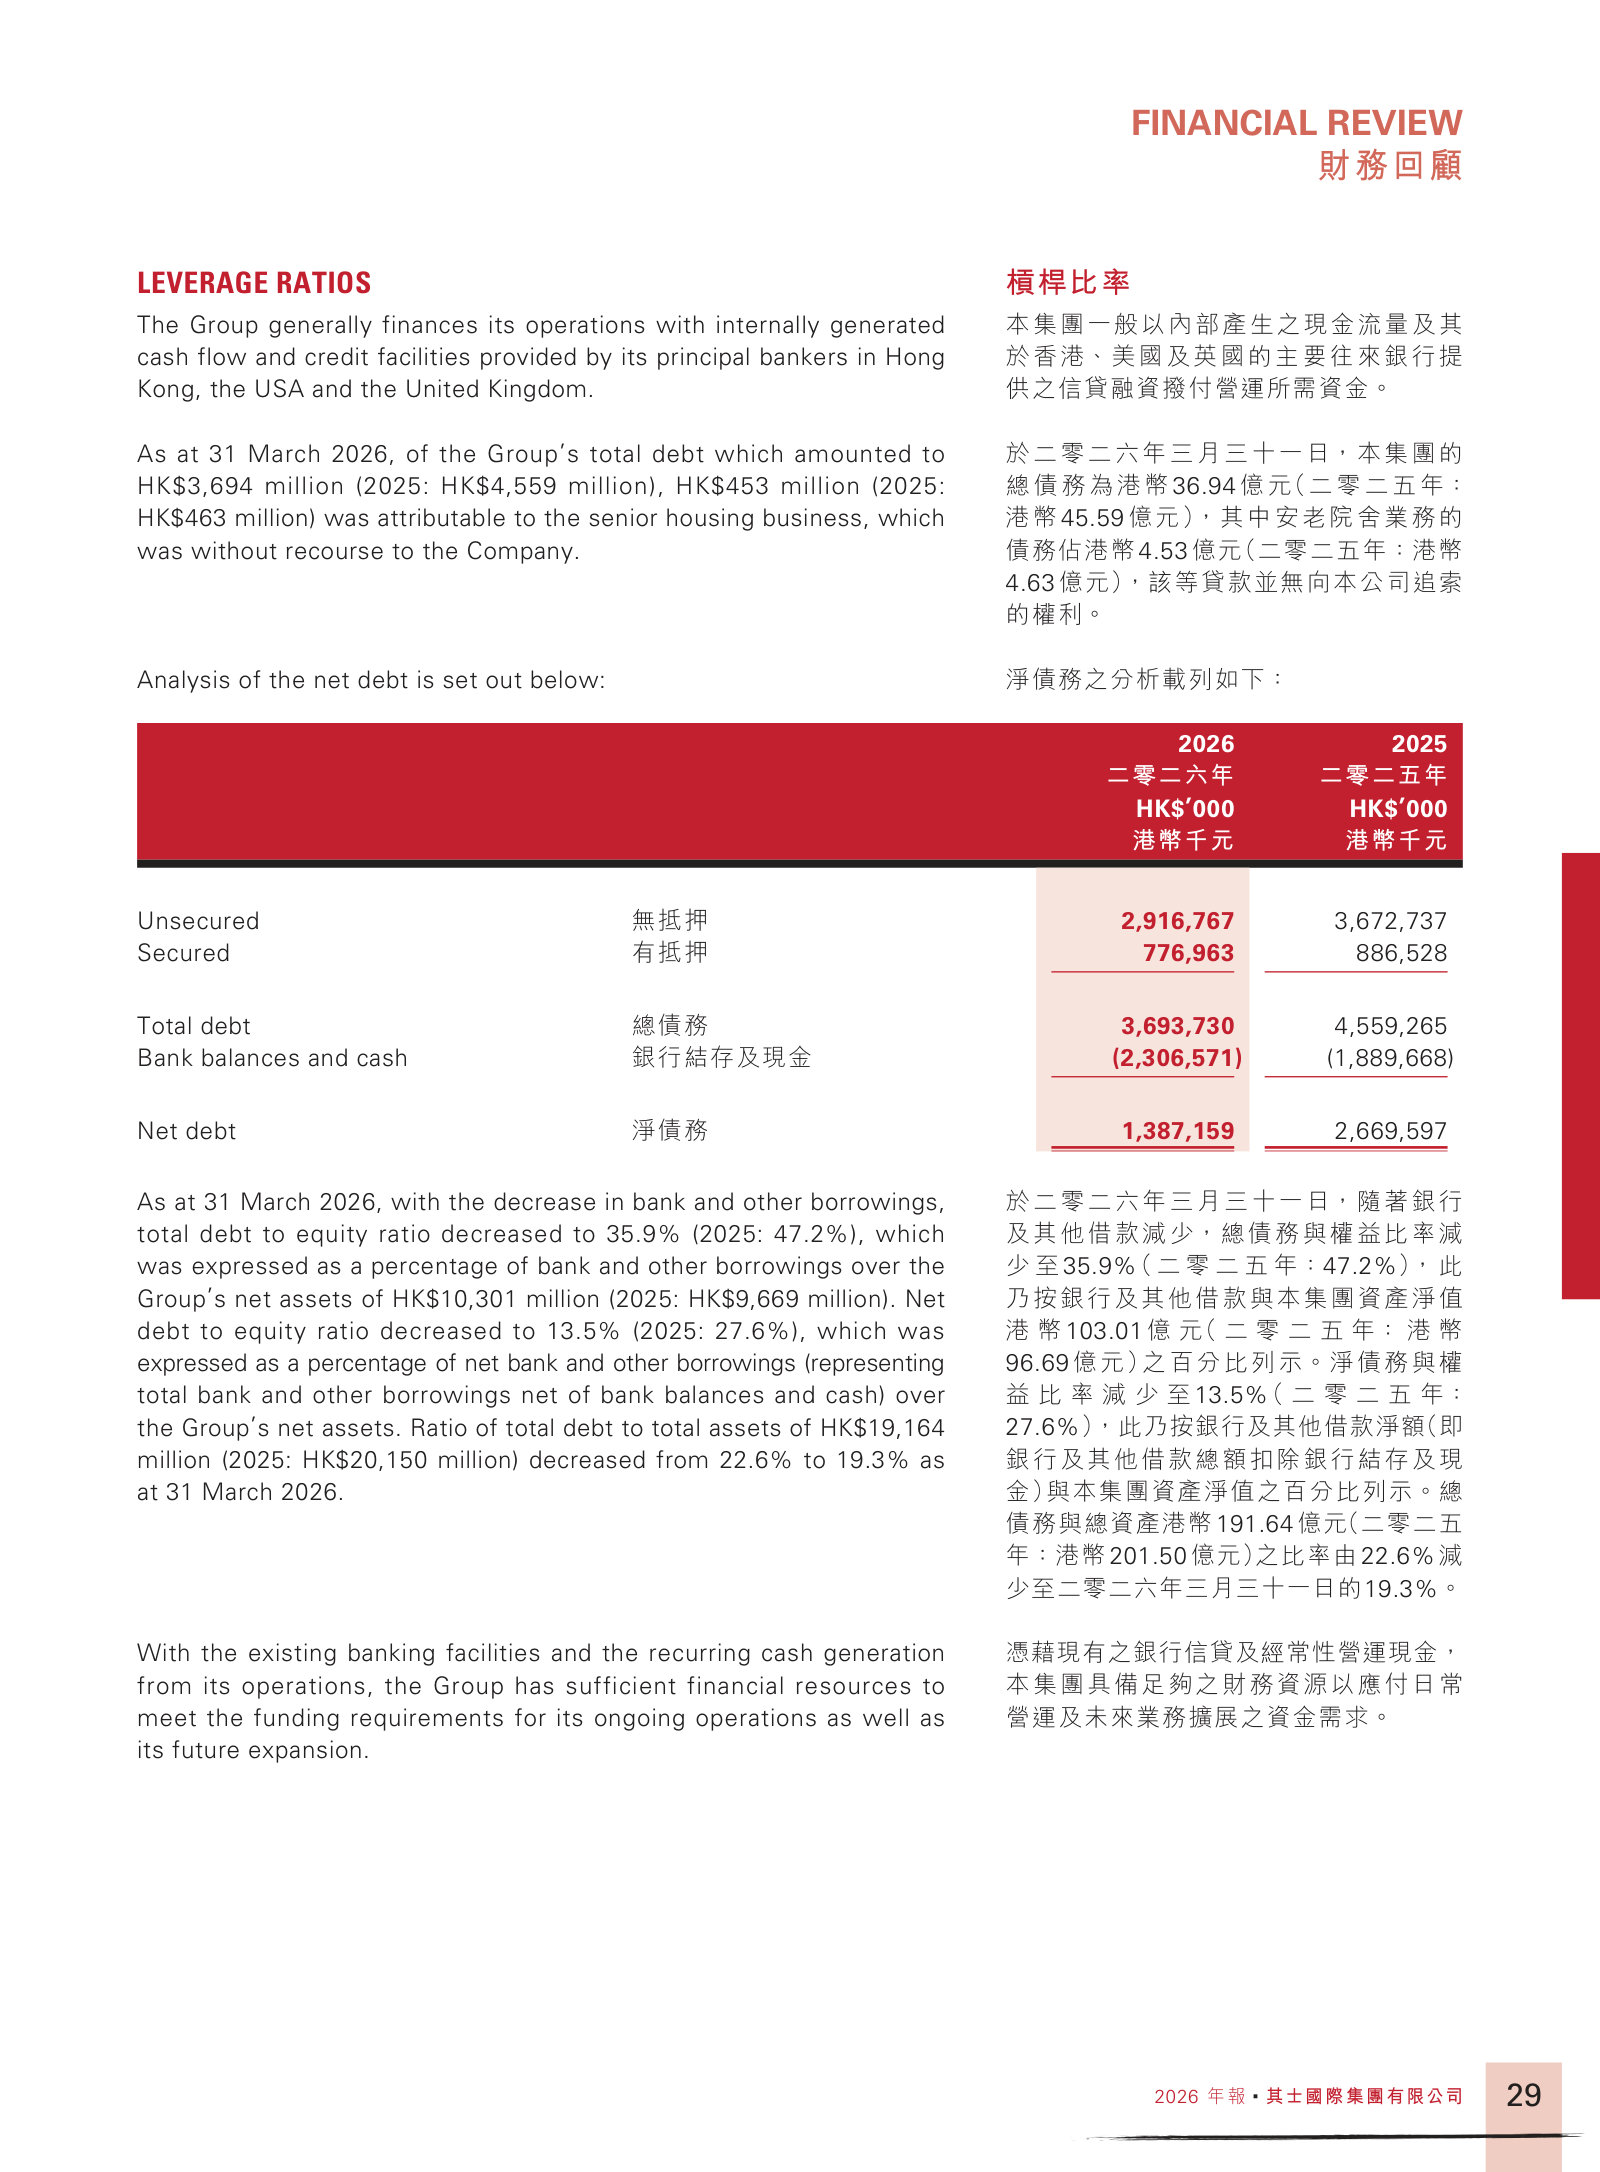
Debt cut by nearly a fifth; net debt almost halved. Key to the investment case for a leveraged property-and-construction conglomerate.
Independent Auditor's Report — Key Audit Matters — p. 66 · Read the full section →
The auditor flags where judgement most drives the numbers: valuing investment properties and recovering development-property carrying values.
KAM 1 — HK$5,856m of investment properties valued on management's assumptions.
The Group’s investment properties were carried at HK$5,856 million as at 31 March 2026 and a net increase in fair value of HK$72 million was recognised in the consolidated income statement.
p. 66 · Read in context →
KAM 2 — recoverability of HK$766m development properties and HK$710m properties for sale.
The Group had HK$766 million and HK$710 million of properties under development and properties for sale respectively as at 31 March 2026.
p. 68 · Read in context →
Note 5 — Segment Information — p. 143 · Read the full section →
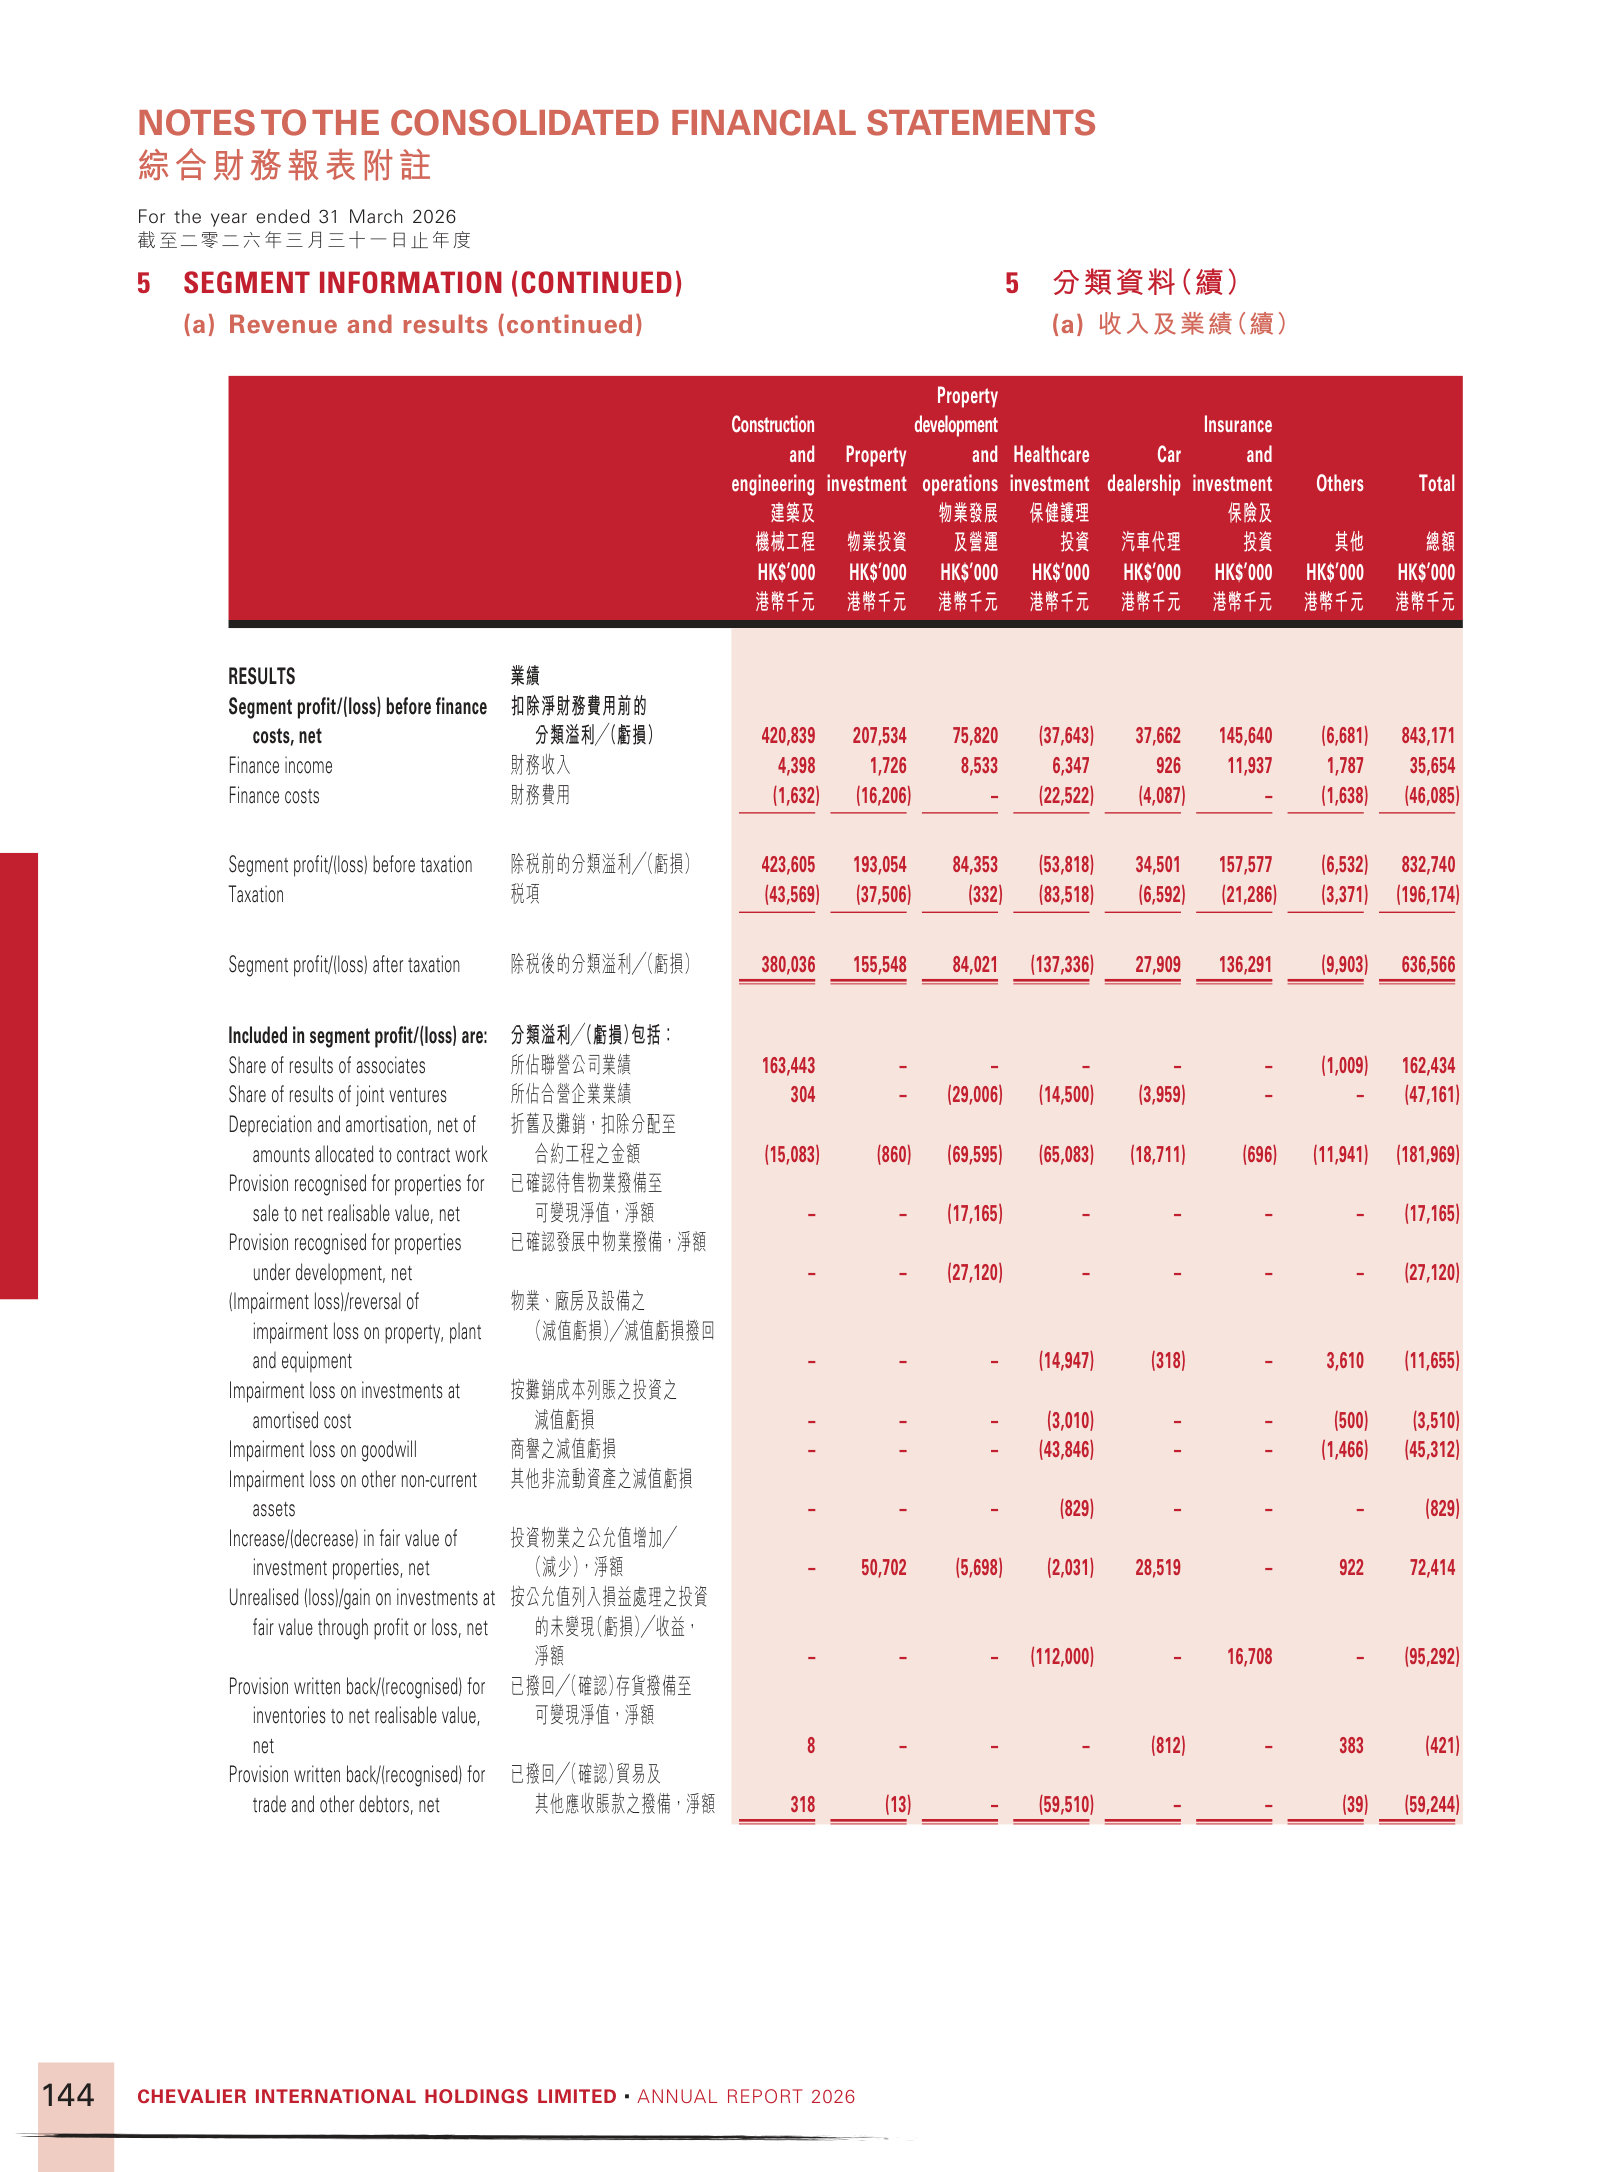
The audited definition of each segment and its revenue/result split — the ground truth behind the MD&A narrative.
How management draws its segment lines — by product/service, as reviewed by the Directors.
The operating segments are determined based on the reports reviewed by the Directors, the chief operating decision maker, that are used to make strategic decisions. The Directors consider the business from a product/service perspective.
p. 143 · Read in context →
More annual reports
Chevalier International Holdings — FY2024/25 Annual Report — FY2025 (year ended 31 March 2025) · 302 pages · The loss year (HK$503m loss) whose provisions and write-downs set up the FY2026 turnaround; also the fullest standalone ESG report. · Open →
Chevalier International Holdings — FY2023/24 Annual Report — FY2024 (year ended 31 March 2024) · 290 pages · First of the two loss years; useful for tracing when property and healthcare provisions began to bite. · Open →
Chevalier International Holdings — FY2022/23 Annual Report — FY2023 (year ended 31 March 2023) · 246 pages · Last profitable year before the downturn; the FY2023 figures are later restated, so worth comparing against the five-year record. · Open →
Chevalier International Holdings — FY2021/22 Annual Report — FY2022 (year ended 31 March 2022) · 226 pages · Peak-earnings year (EPS HK$2.13, dividend HK$0.50); the high-water mark for the current portfolio. · Open →
Competitors describe Chevalier International Holdings Limited's market in their own filings and calls. These verified passages and visual pages show where their strategies meet, using source documents preserved in Sources.
Analogue Holdings Limited (ATAL Engineering) (1977.HK)
ATAL is the closest listed comparable to Chevalier's construction-and-engineering arm: a Hong Kong-headquartered electrical & mechanical (E&M) engineering contractor bidding for the same building-services, environmental, ICT and public-works packages across Hong Kong, the Mainland and overseas. Its 2024 results call sizes the shared Hong Kong market, describes the competitive conditions both firms face, and lays out the construction-technology edge it is using to win work.
ATAL describes the E&M engineering franchise that overlaps Chevalier's construction and engineering business.
Kin Wah Mak, Chairman: Analogue Holdings Limited is a leading provider of electrical and mechanical engineering solutions and information and communications technology services for smart cities with headquarters in Hong Kong and operations in Macau, the Mainland, U.S. and the U.K.
p. 1 · Read in context →
Asked whether the industry's downturn is hurting it, ATAL's chairman frames the competitive backdrop and where it expects demand to come from.
Kin Wah Mak, Chairman (answering an analyst on the tough construction market): it's true that there have been challenges over the past years, well, with COVID-19 followed by economic downturn around the world. But if you look at the Mainland Chinese market, it remains broadly resilient […] Because we have a broad base of business and we have a leadership position in what we do, we are in a good position to capture the market opportunities arising from changing priorities towards data solution – data center, environmental engineering and climate solutions, hospitals, infrastructure and so on.
p. 6 · Read in context →
ATAL's stated construction-technology advantage — MiMEP and DfMA adoption across most of its building-services projects — the kind of productivity edge that shapes tender competition.
Wai Keung Cheng, CFO: As an industrial pioneer in the adoption of advanced construction technology, we have successfully implemented MiMEP and other construction technology like DfMA and MiMEP in more than 50% of our building service project
p. 7 · Read in context →
Build King Holdings Limited (0240.HK)
Build King is a pure-play Hong Kong building-construction and civil-engineering contractor competing directly with Chevalier's construction arm for public-works and building packages. Its results announcements offer an unusually candid read on the same Hong Kong market — the size of secured order books, an explicit 'market downturn', and the margin and pricing pressure now running through HK construction.
Build King's own description of its construction offering — the same full-spectrum building and civil scope Chevalier competes in.
The Group provides a full spectrum of construction services from building construction and civil engineering to foundation, electrical and mechanical, interior refurbishments and fitting out works in Hong Kong.
p. 22 · Read in context →
Build King characterises the Hong Kong construction environment as a 'market downturn' as it declares a special dividend (FY2024 results).
the Board has decided to distribute an additional special dividend of HK6.0 cents per ordinary share to ease the burden on most shareholders under the market downturn.
p. 20 · Read in context →
A year on, Build King attributes weaker segment profit to slow land resumption and a lower price-fluctuation index — pricing pressure both contractors share.
The decline was mainly attributable to delays in certain newly awarded projects caused by slow land resumption, as well as a decrease in the price fluctuation index.
p. 22 · Read in context →
More peer documents
Build King Holdings — Interim Results — H1 FY2025 · 23 pages · Half-year read on Build King's HK order book and margins between the annual results featured above. · Open →
Build King Holdings — Interim Results — H1 FY2024 · 26 pages · Earlier interim showing how Build King's contracts-on-hand and construction margins were trending into the downturn. · Open →